
Market Analysis Maps allow you to visualize data and trends throughout your markets, often with thematic shading or dot densities. These maps typically provide market-wide insights and provide an easy to understand snapshot of varying densities of key attributes throughout your market. If there are qualities your prospects must posses, such as owning a single family home, our market analysis maps can point you in the right direction.
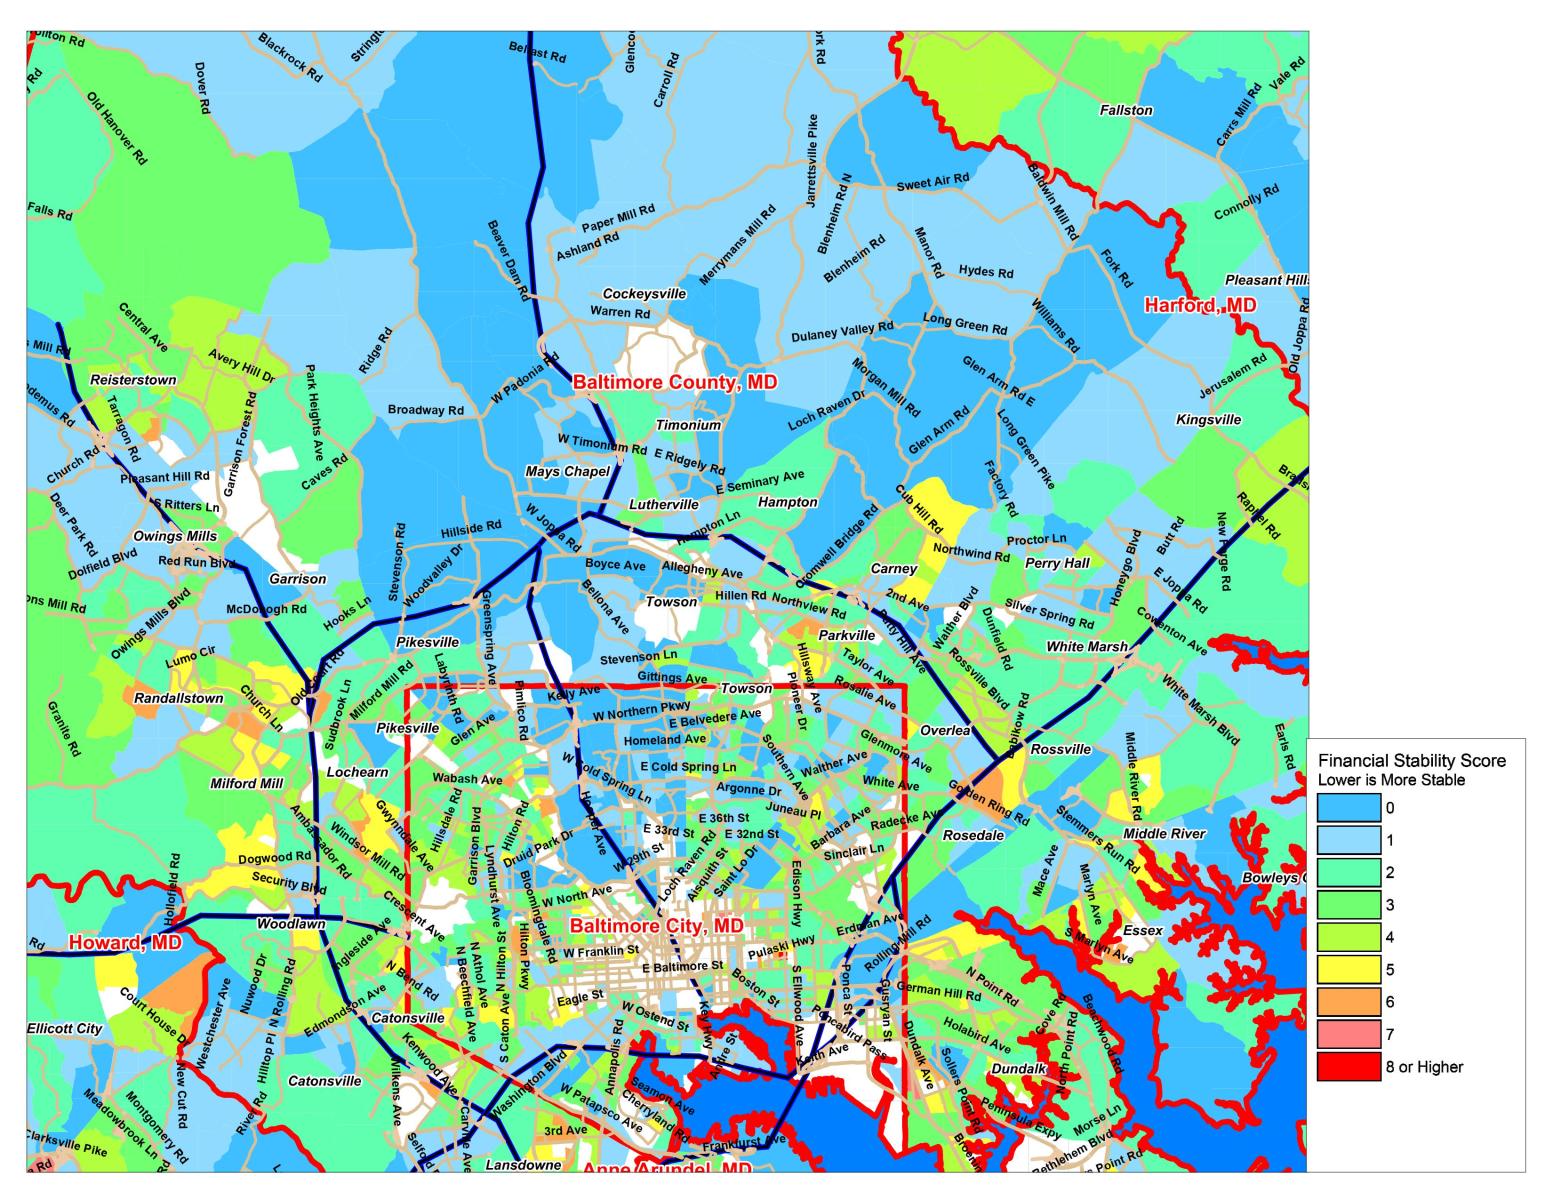 As part of a market analysis for a home services company, a custom data point for measuring financial stability is shaded thematically over the Baltimore market to identify areas for prospect targeting.
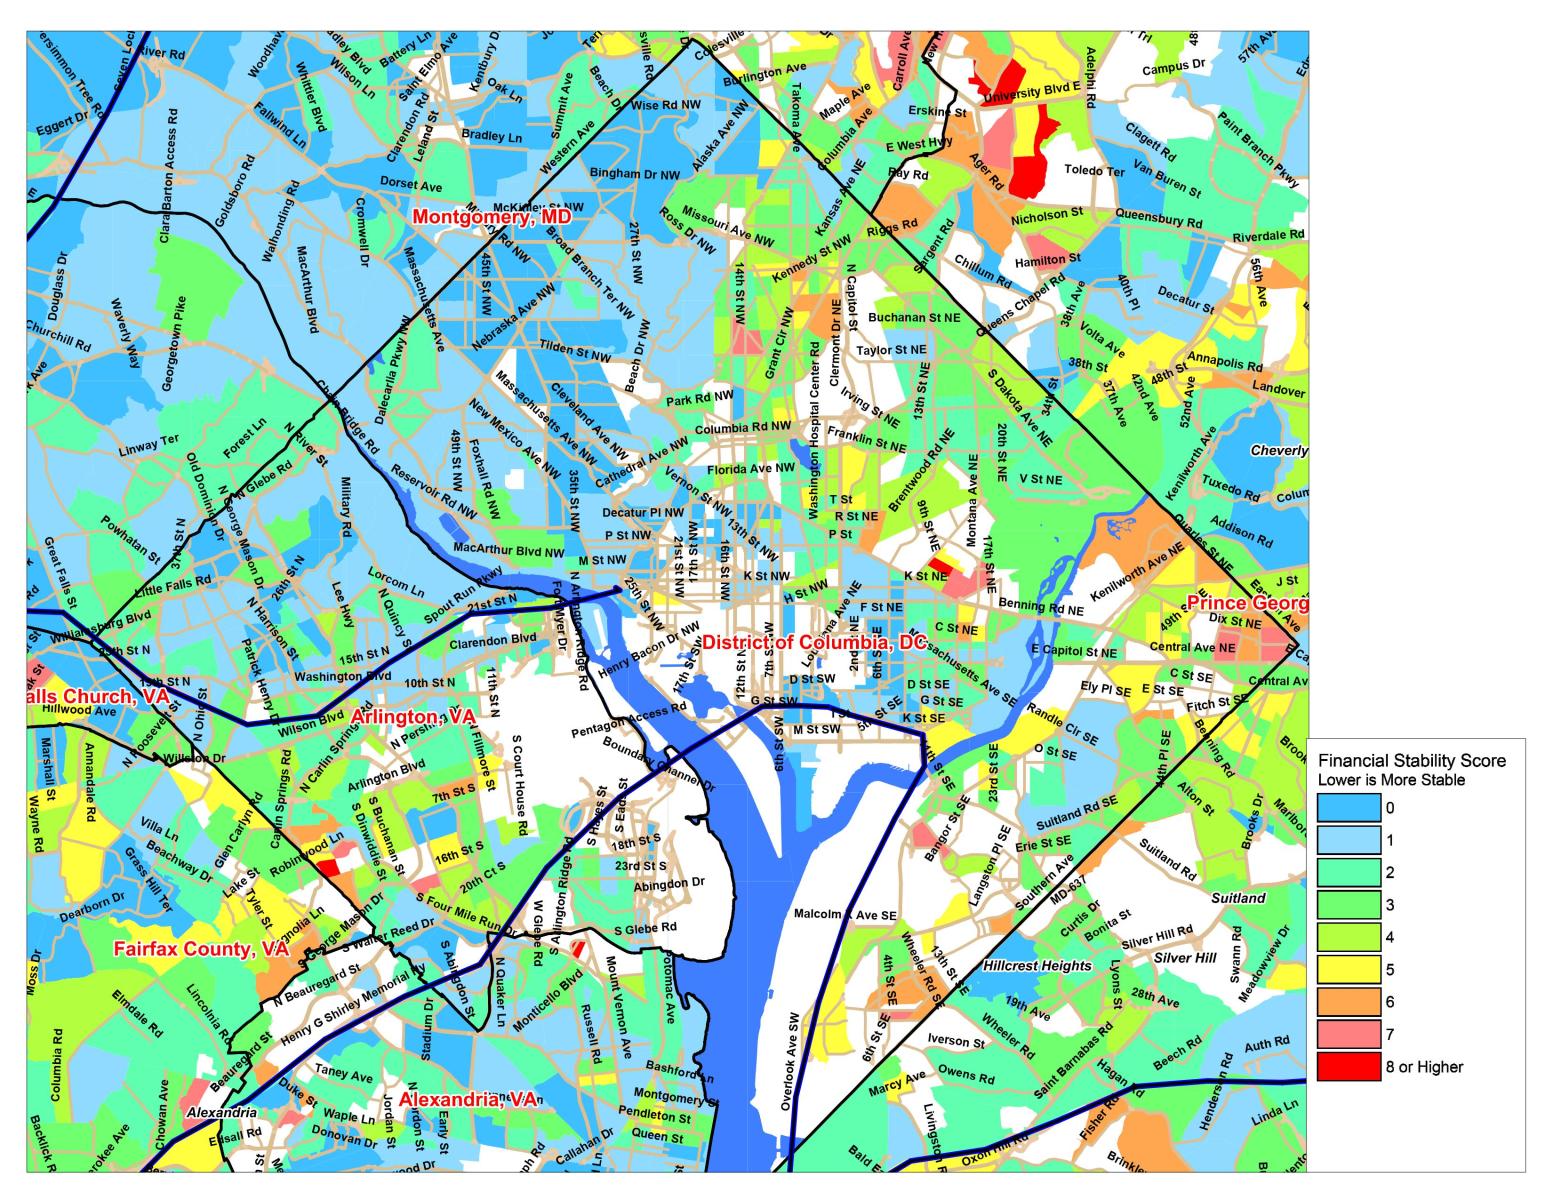 As part of a market analysis for a home services company, a custom data point for measuring financial stability is shaded thematically over the Washington DC market to identify areas for prospect targeting.
 The client was seeking areas of younger homeowners for a targeted ad campaign. This map highlights census block groups in the Washington DC market where the dominant homeowner age bracket is Under 35.
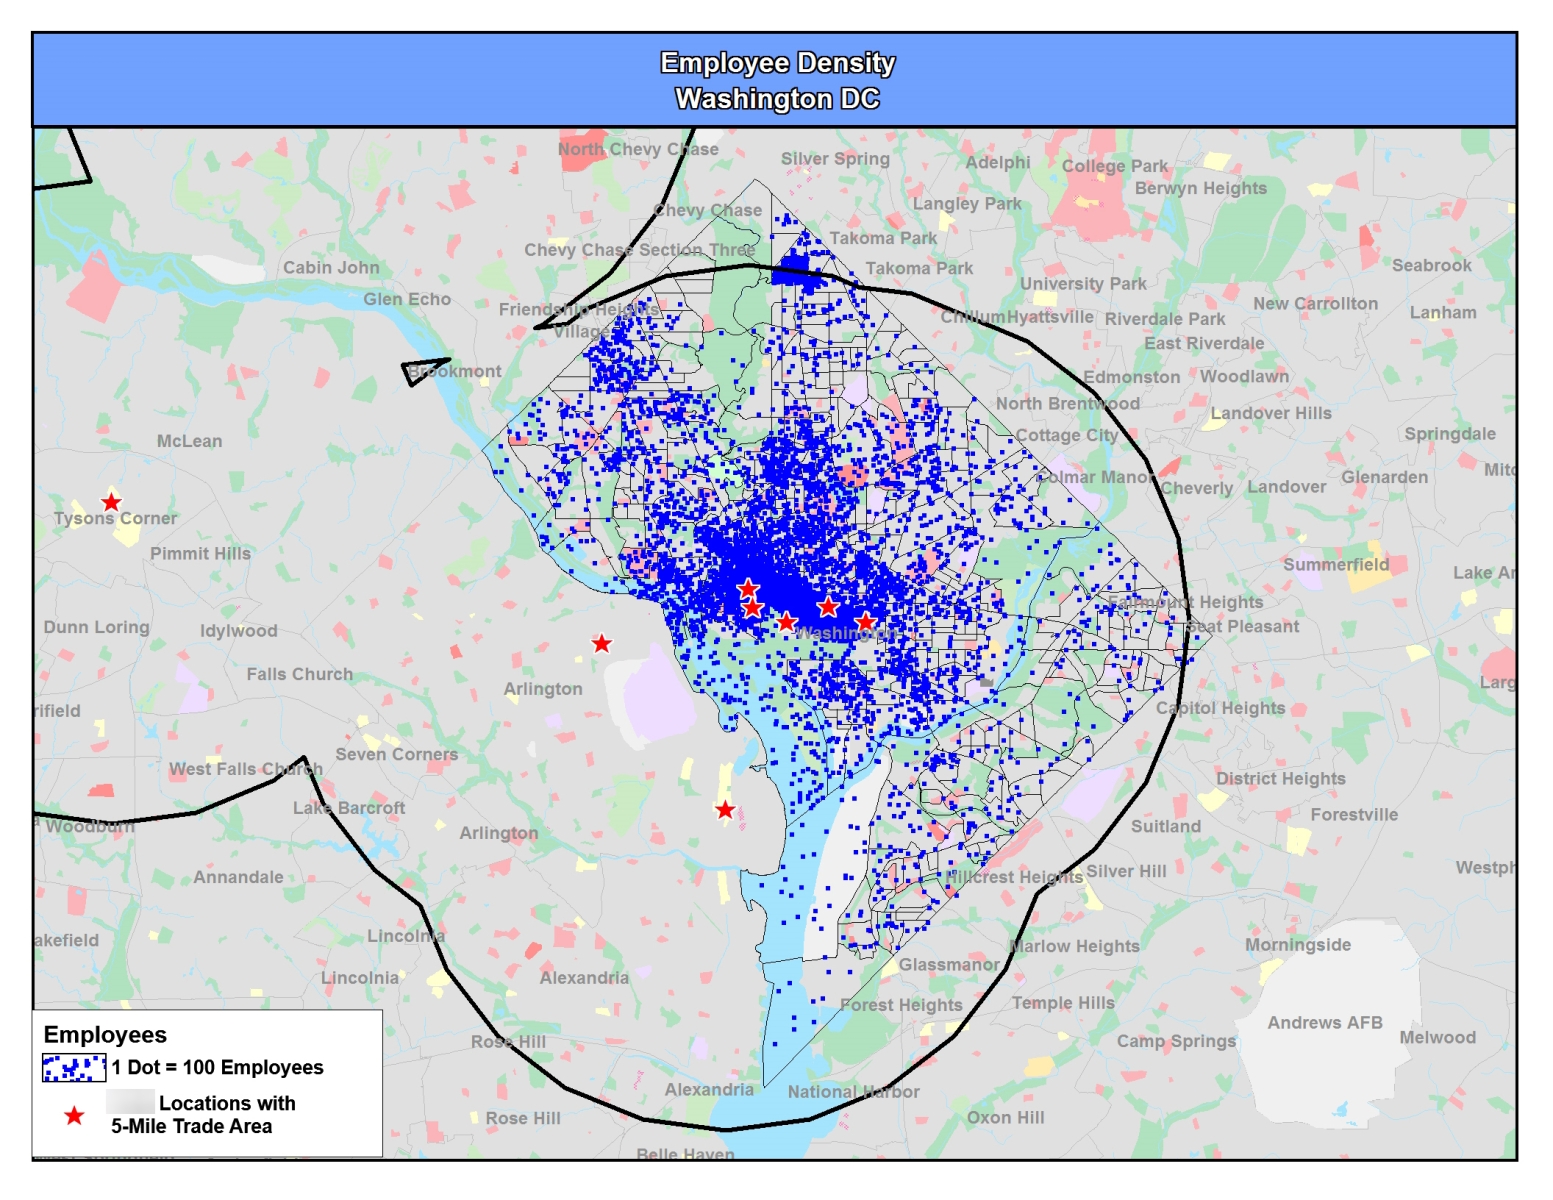 Customer identified employee population as a key driver for success. New Perspective utilized a dot density map to illustrate employee density with existing outlet locations.
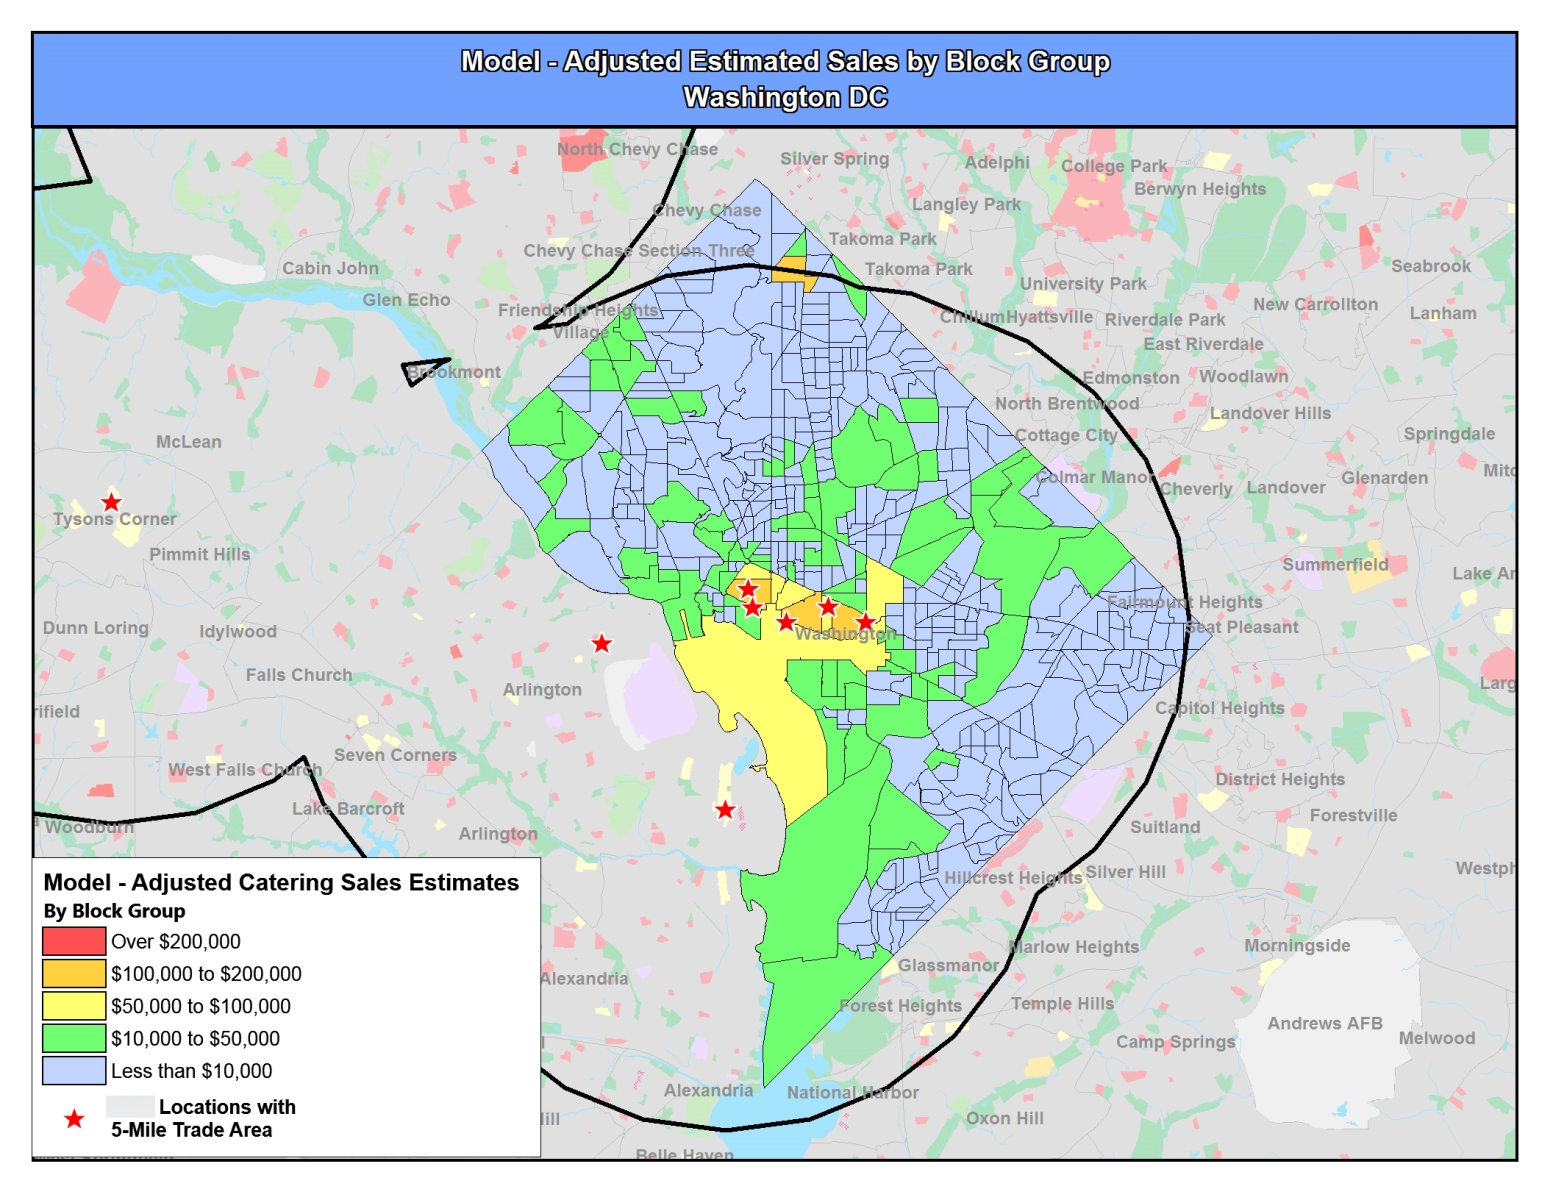 Results of a catering market study are mapped with existing catering kitchens in the market. The purpose of this map was to identify prospect areas for a new catering kitchen that would be located near high potential areas.
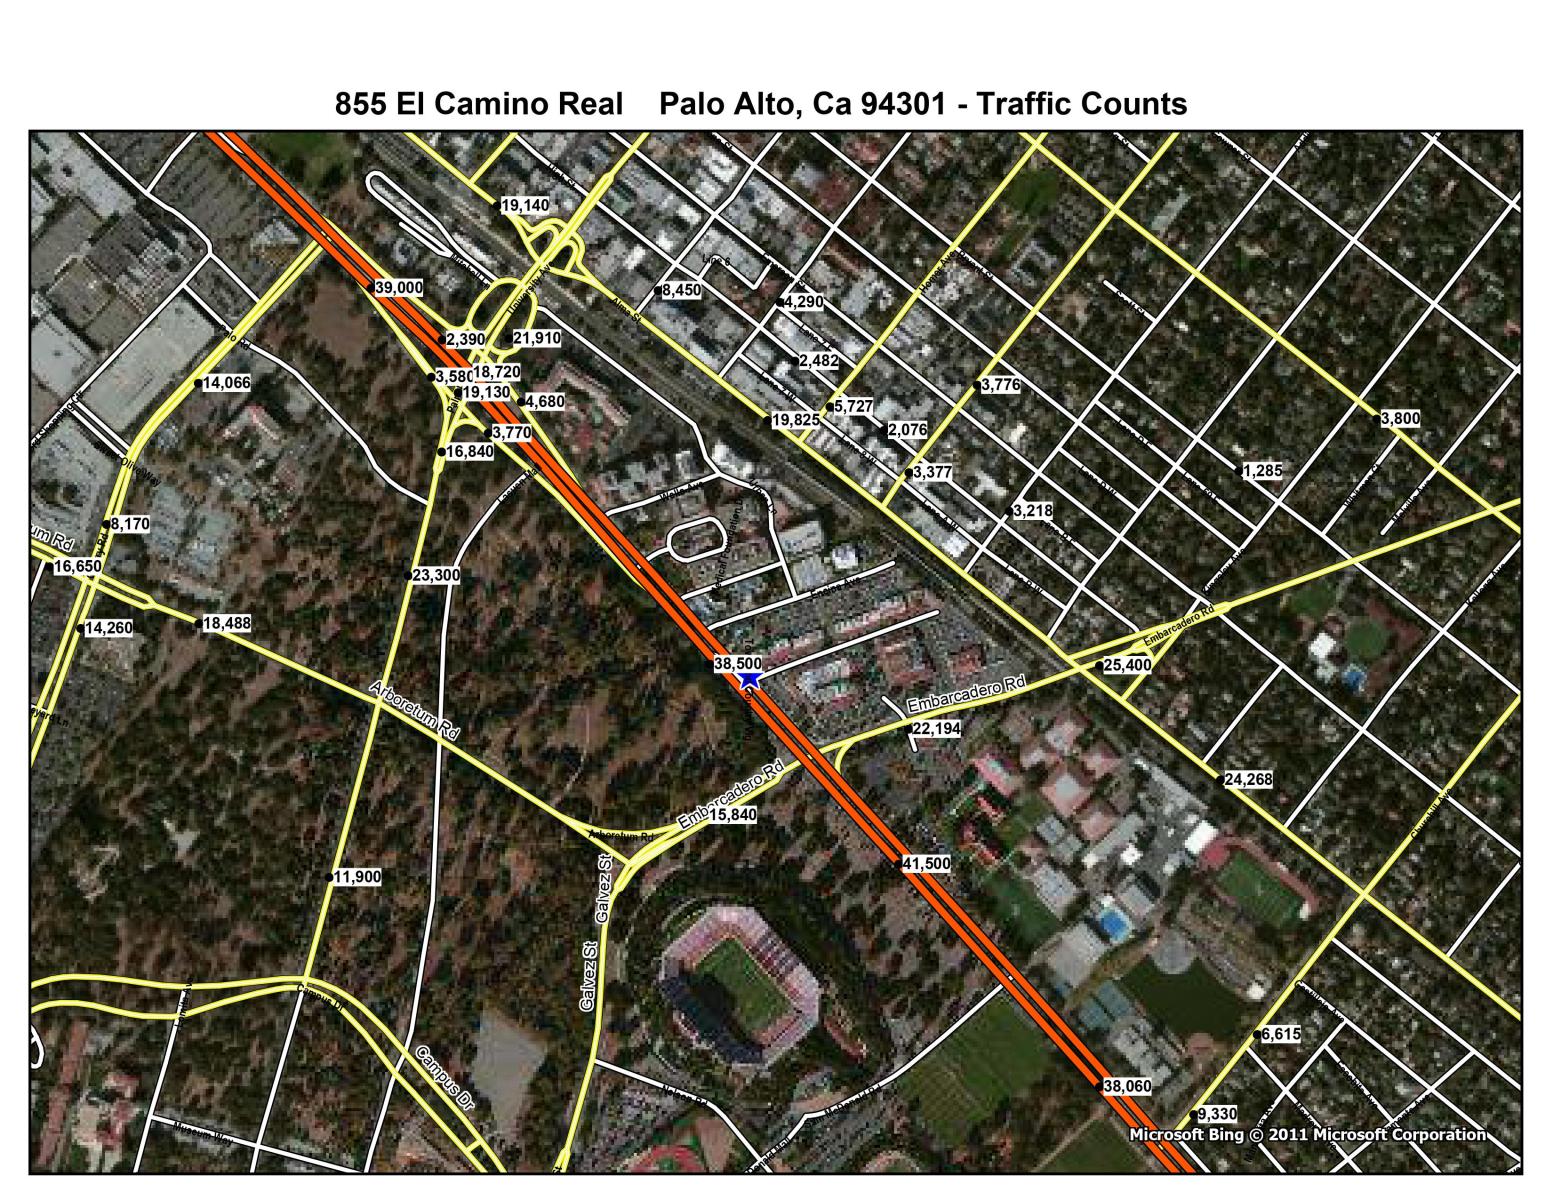 New Perspective has thousands of data points available for analysis. Here, traffic count data by intersection is overlaid on a satellite map to identify top prospect intersections.
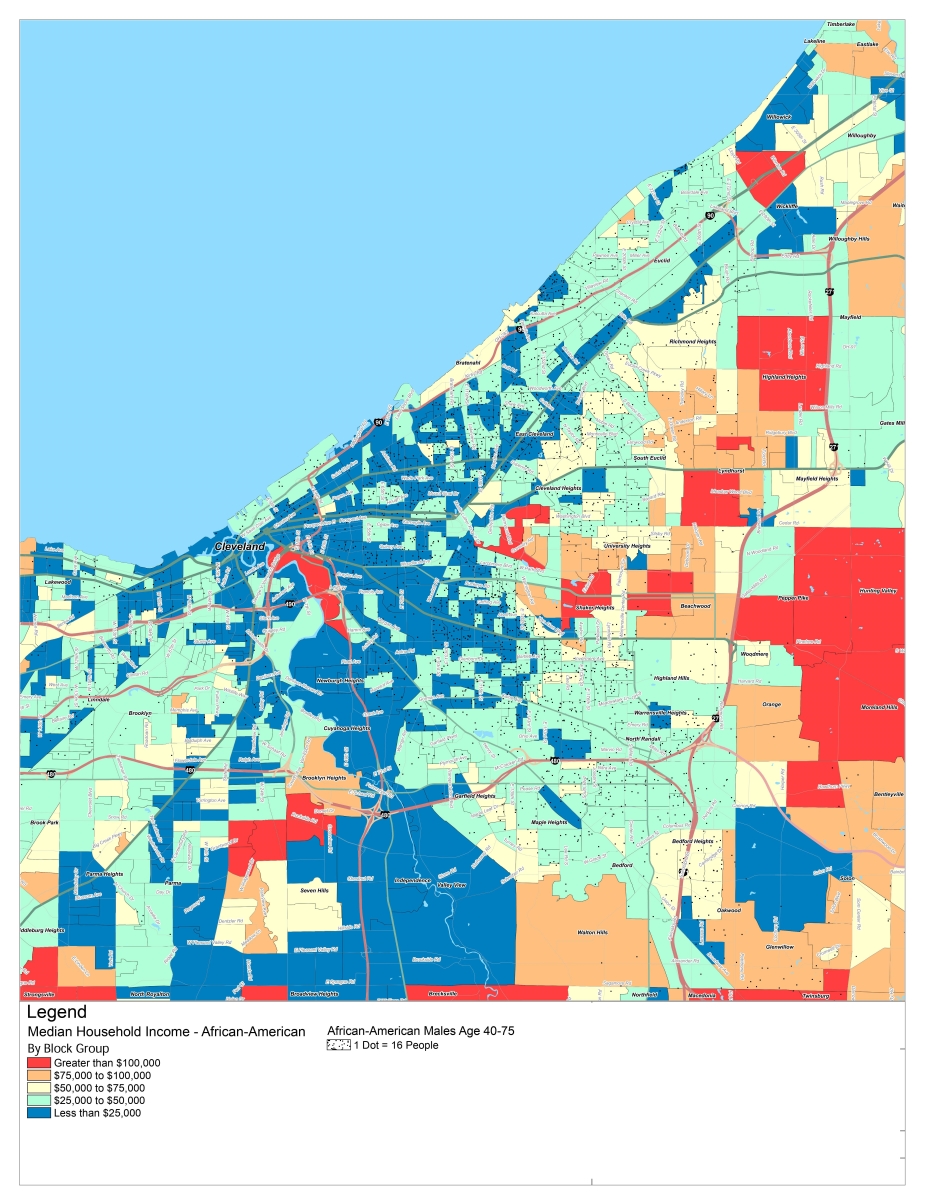 A medical client was seeking outreach to high-earning African-American men. This map illustrates African-American household income as a shaded theme while plotting the specific cohort of African-American males being targeted as a dot-density overlay. Key areas of high income and density were identified as well.
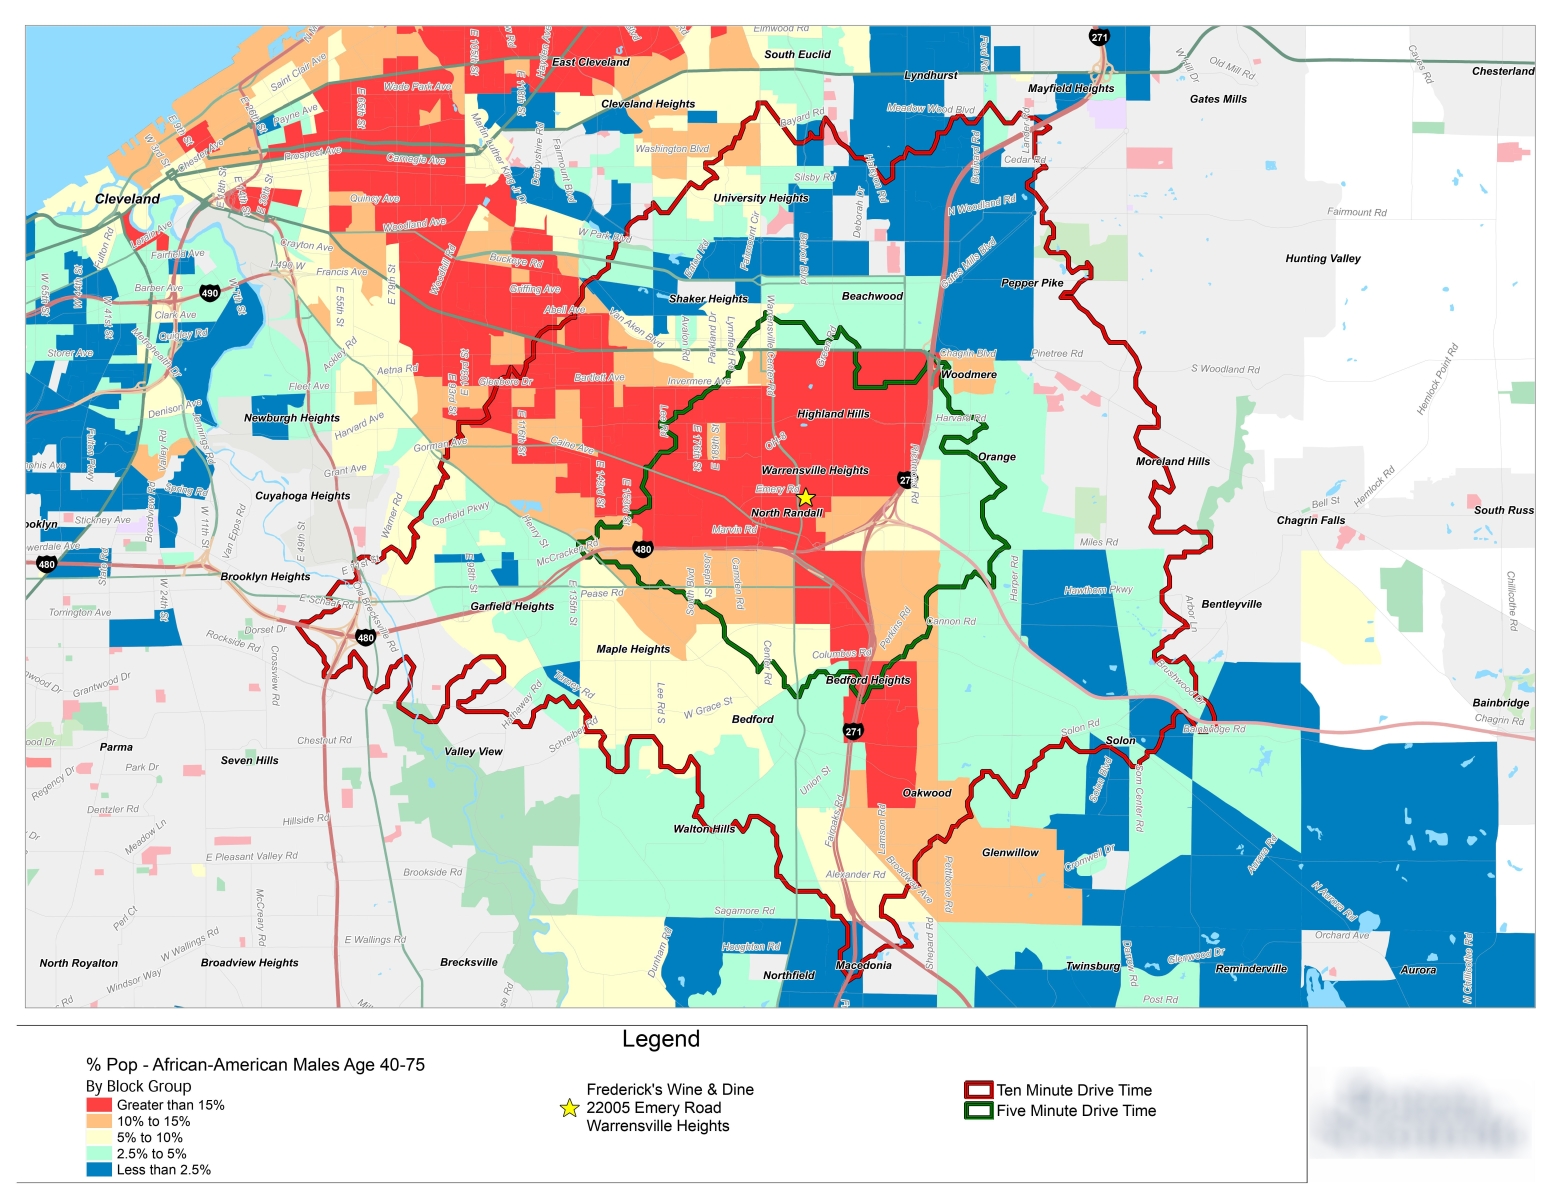 Drive Time creation example. Drive time was created around a community outreach site, laid over a thematic of target population density to evaluate suitability of outreach site.
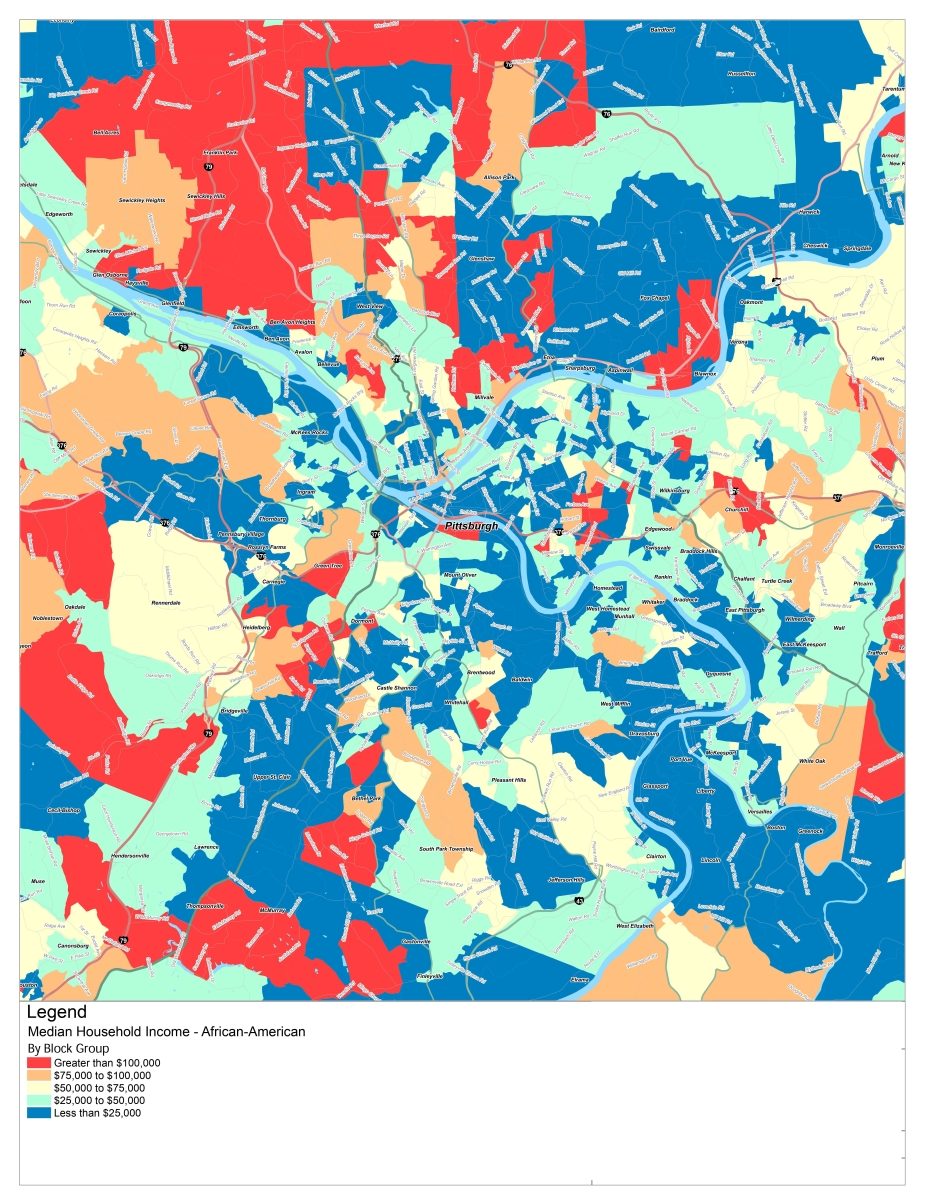 African-American household income by census block group expressed as thematic shades.
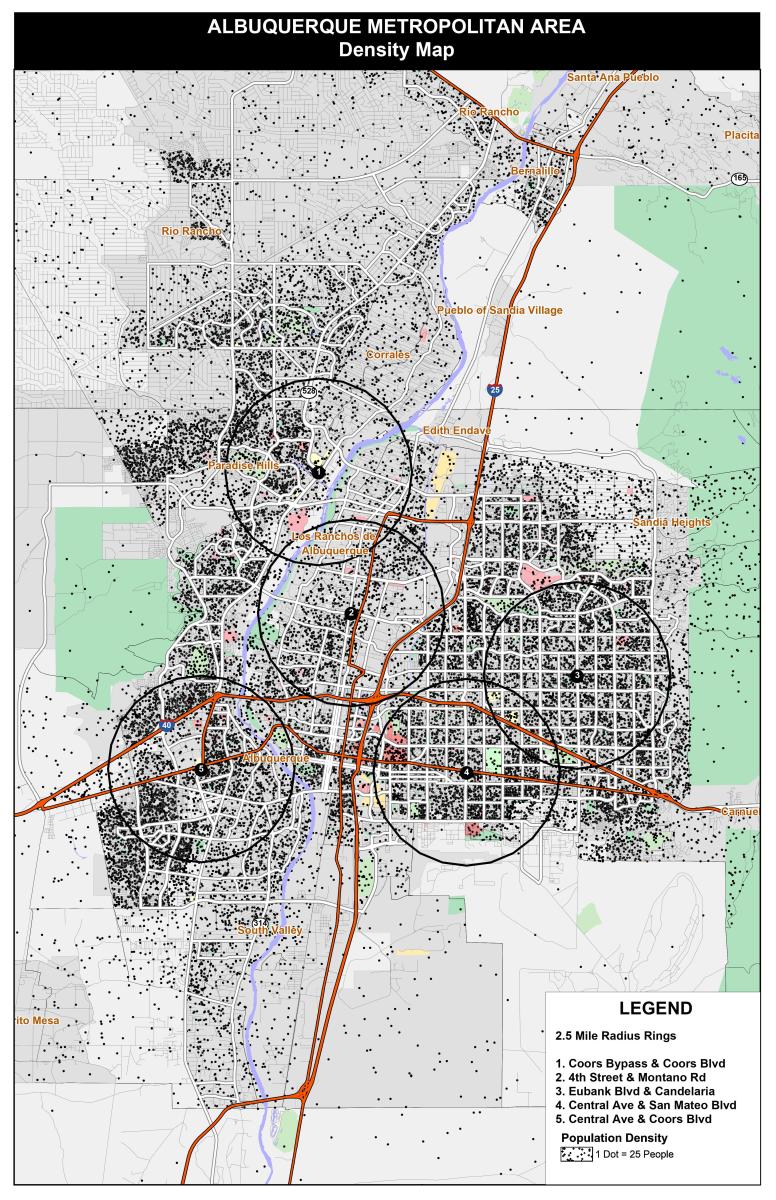 Population illustrated through dot-density (25 people per dot) and customer locations within the Albuquerque market.
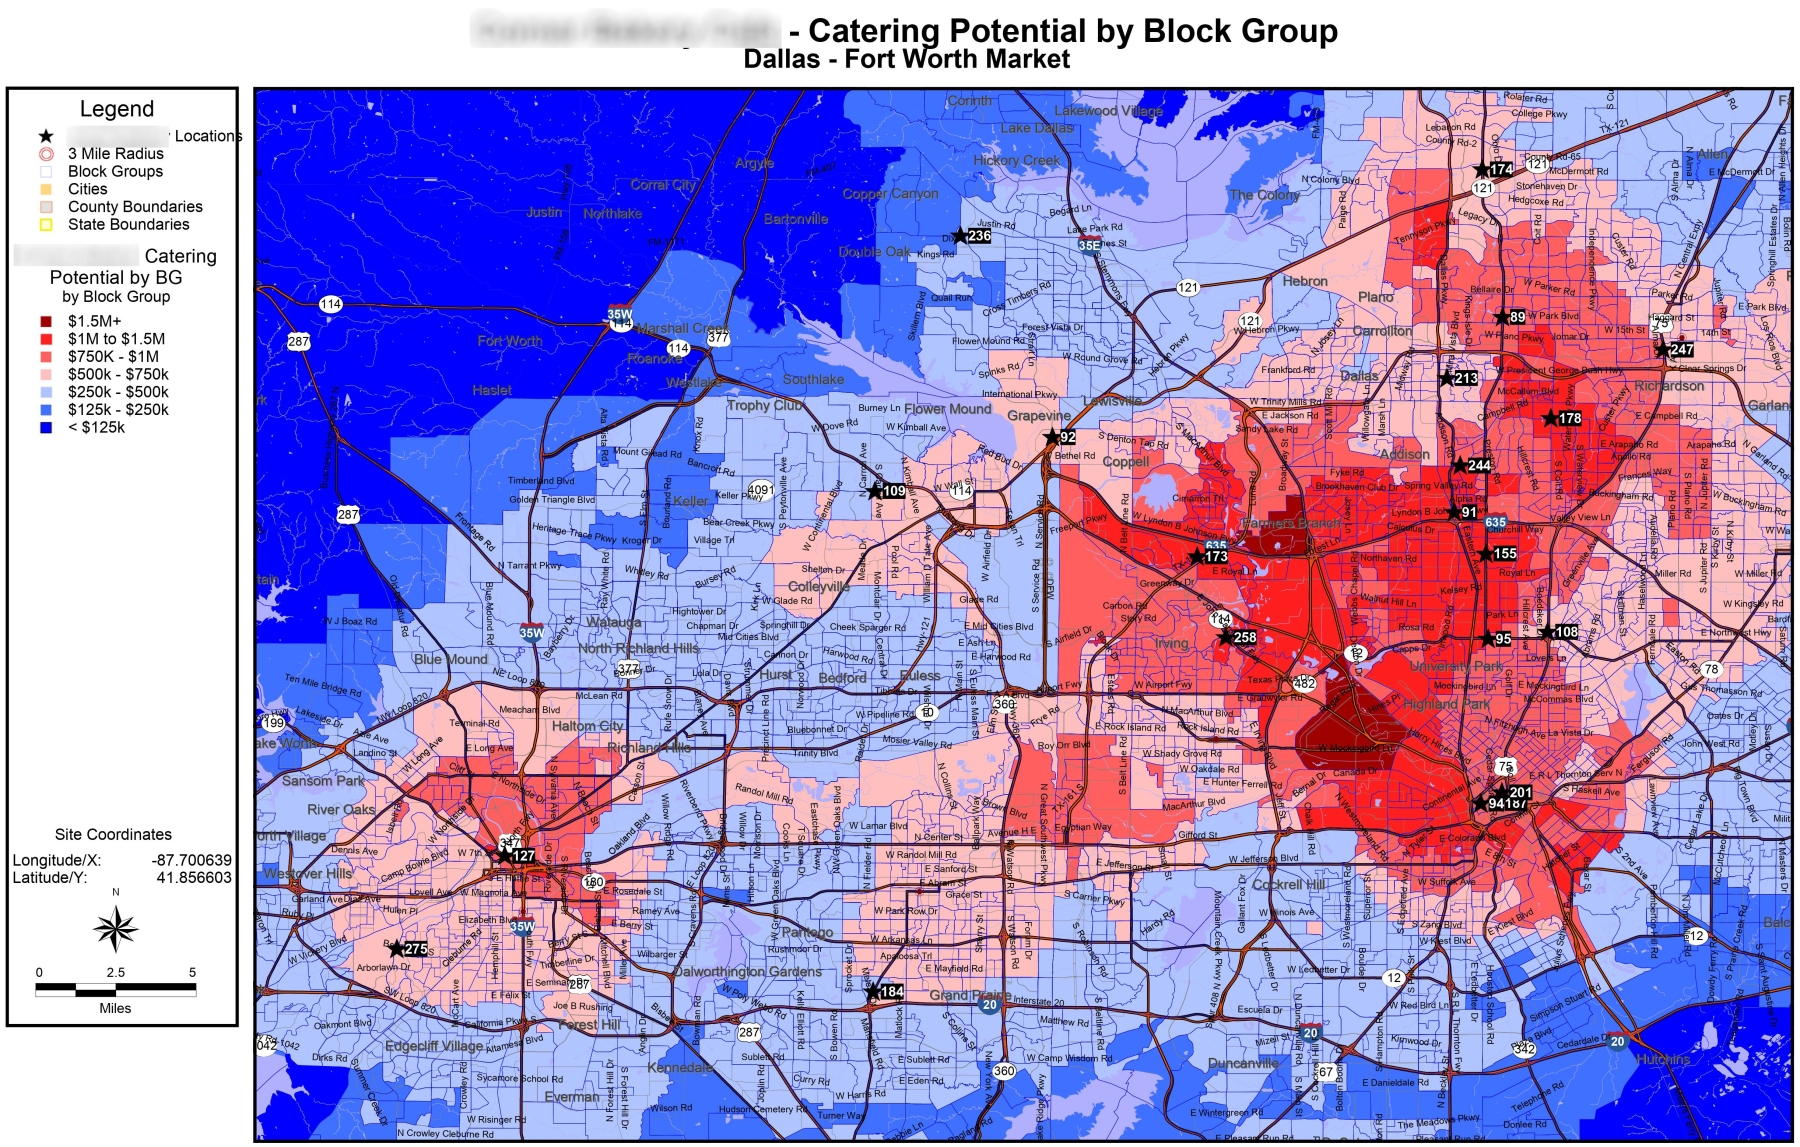 Client worked with a New Perspective partner to derive a catering sales model based on sales history, customer demographics and survey data. Potential was calculated at the census block group level and mapped thematically over the target market and catering kitchen locations.
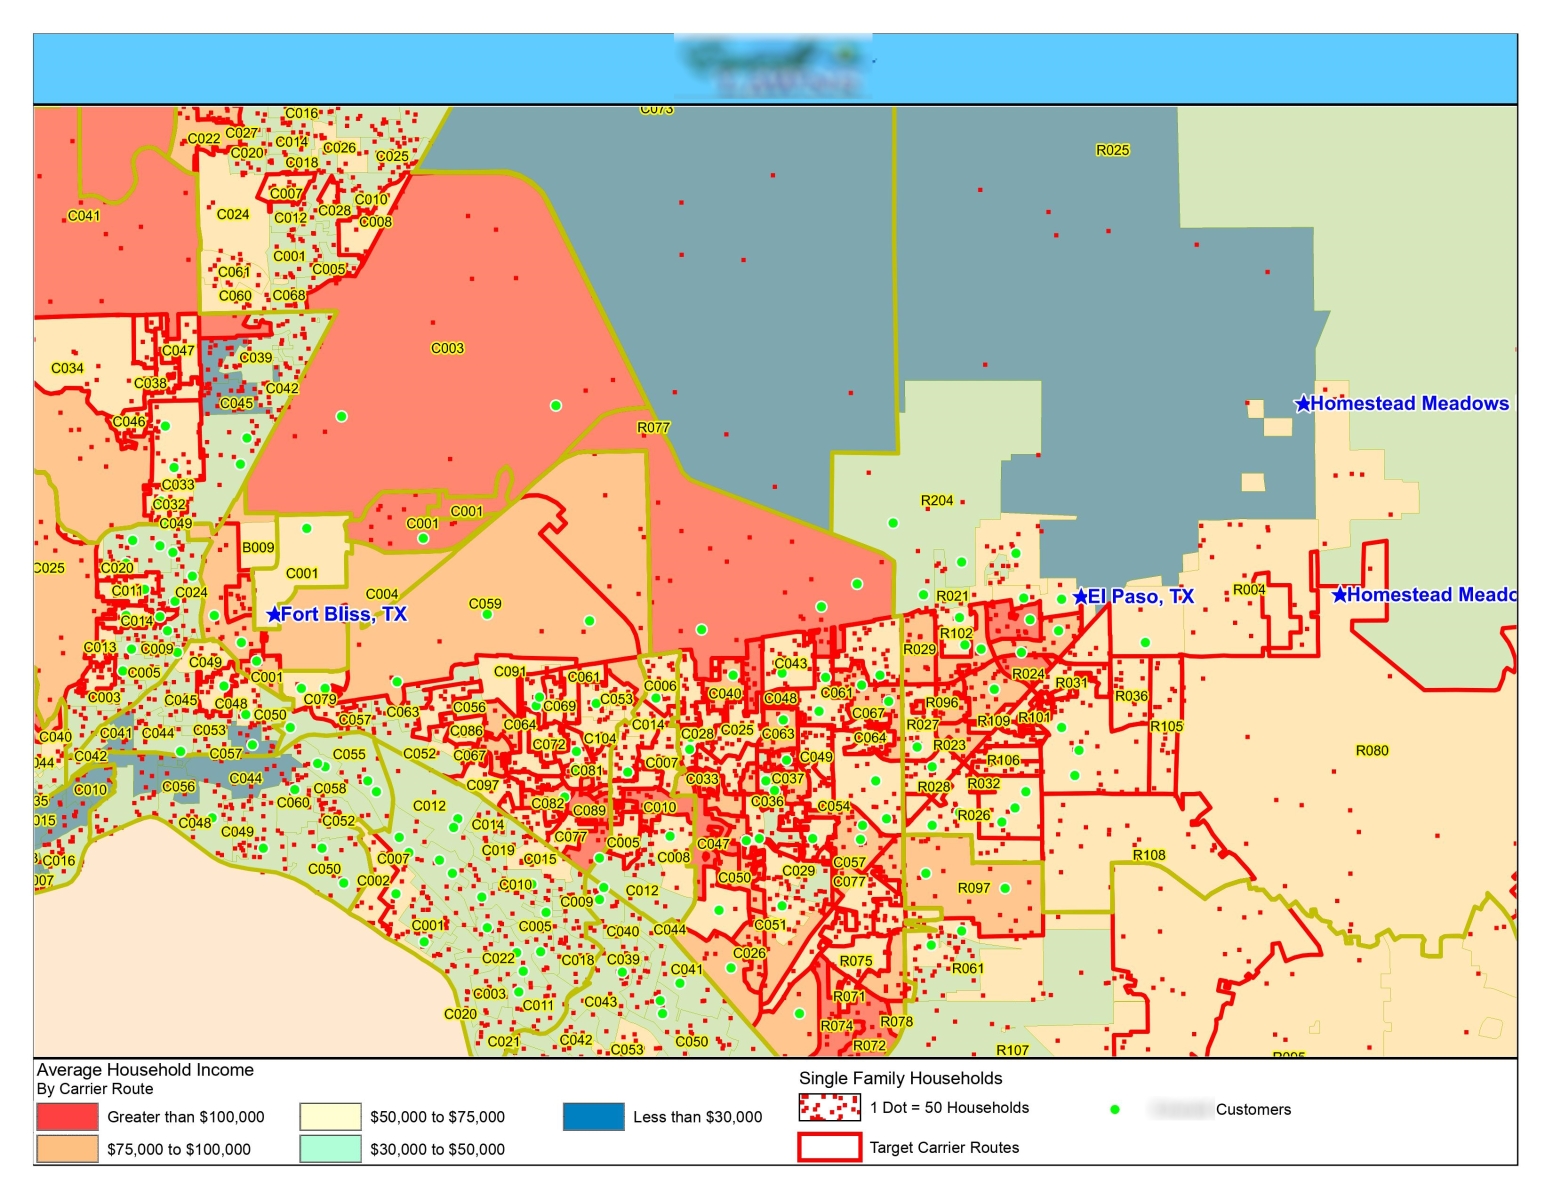 Lawncare Services client was planning targeted mailing campaign by carrier delivery routes. Key demographic data was combined with density of single family homes and current customers to identify target carrier routes for campaign.
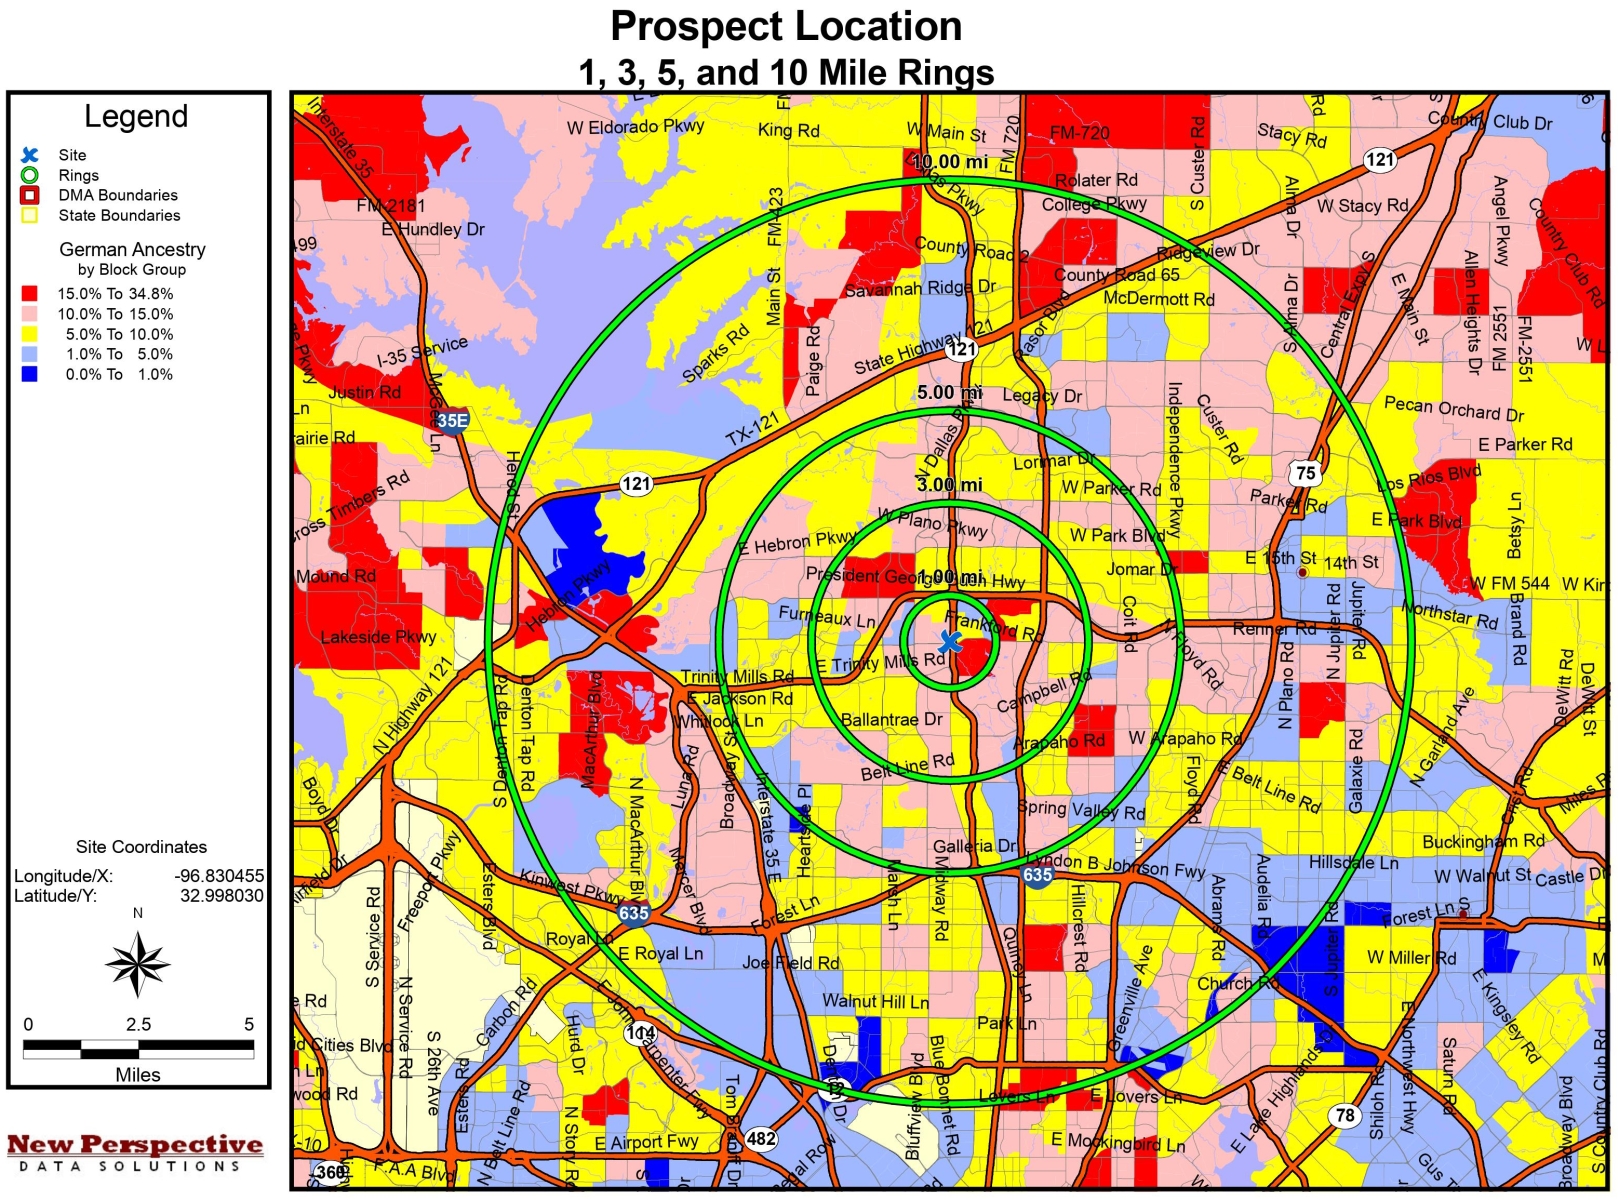 Customer was evaluating sites for a German-American restaurant. Sites were plotted with reference rings over a thematic map of population by German ancestry.
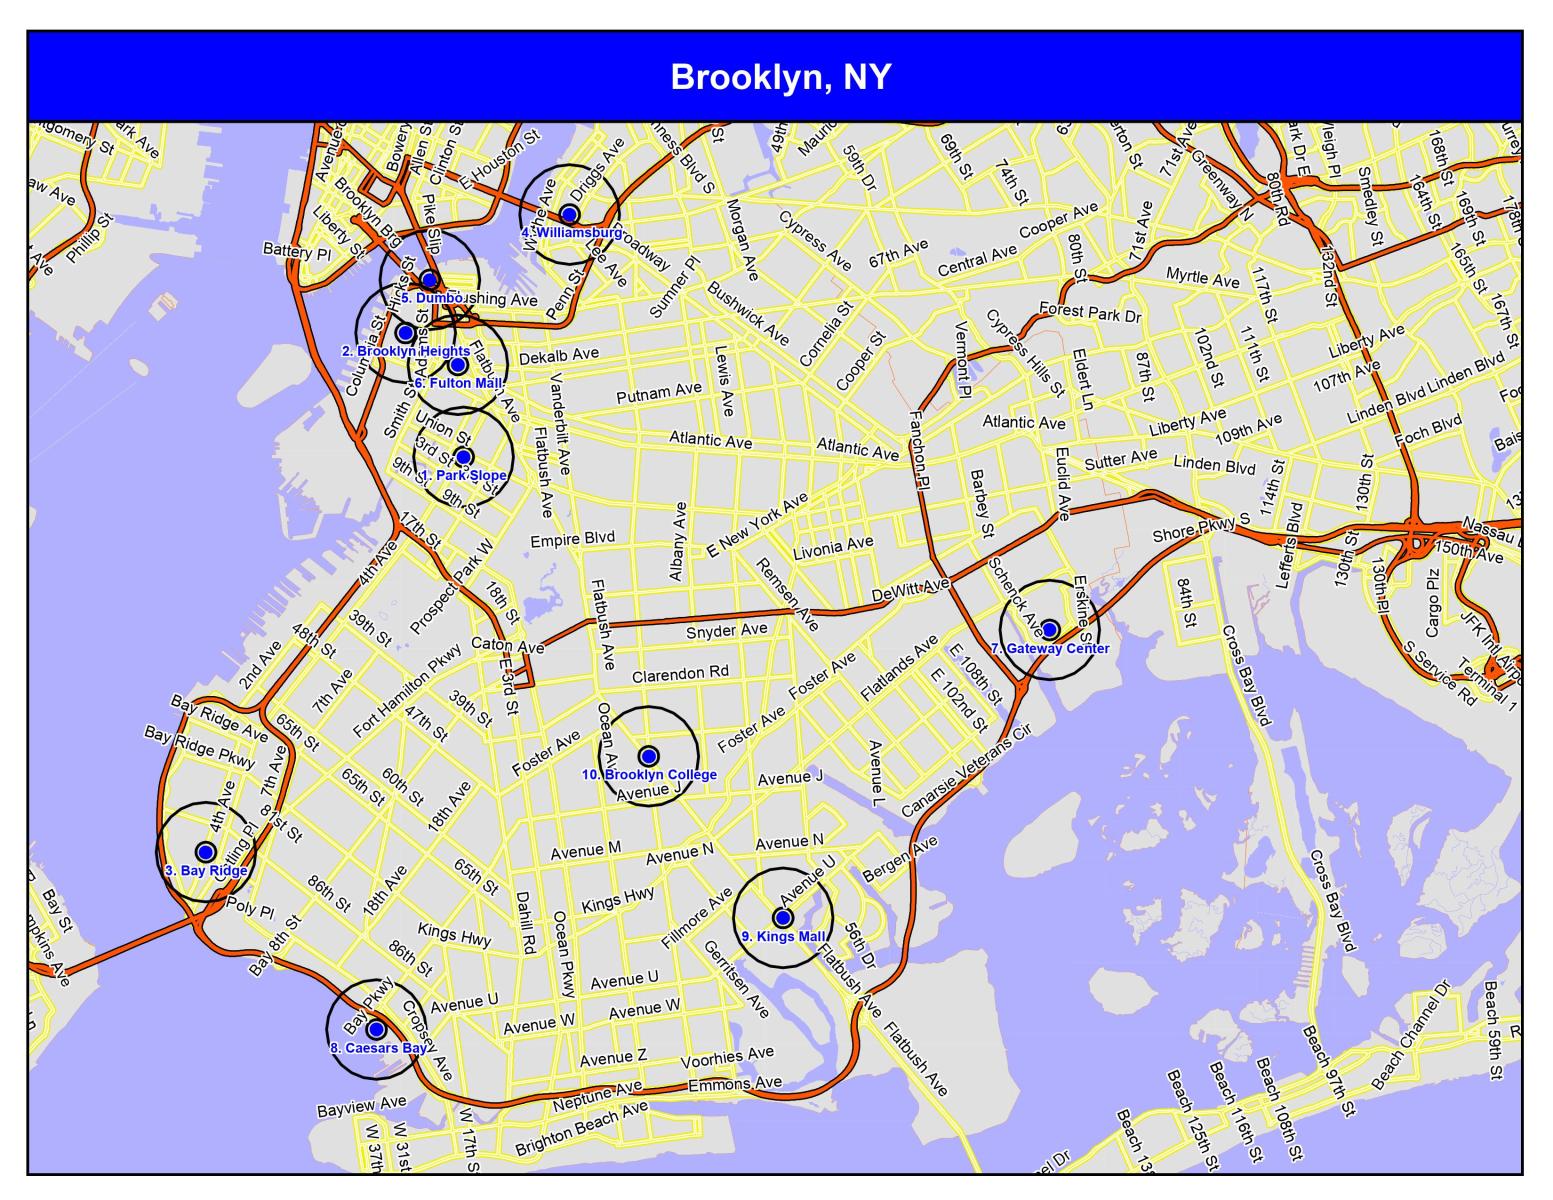 A relatively simple market map showing client locations with designated trade areas and detailed street data.
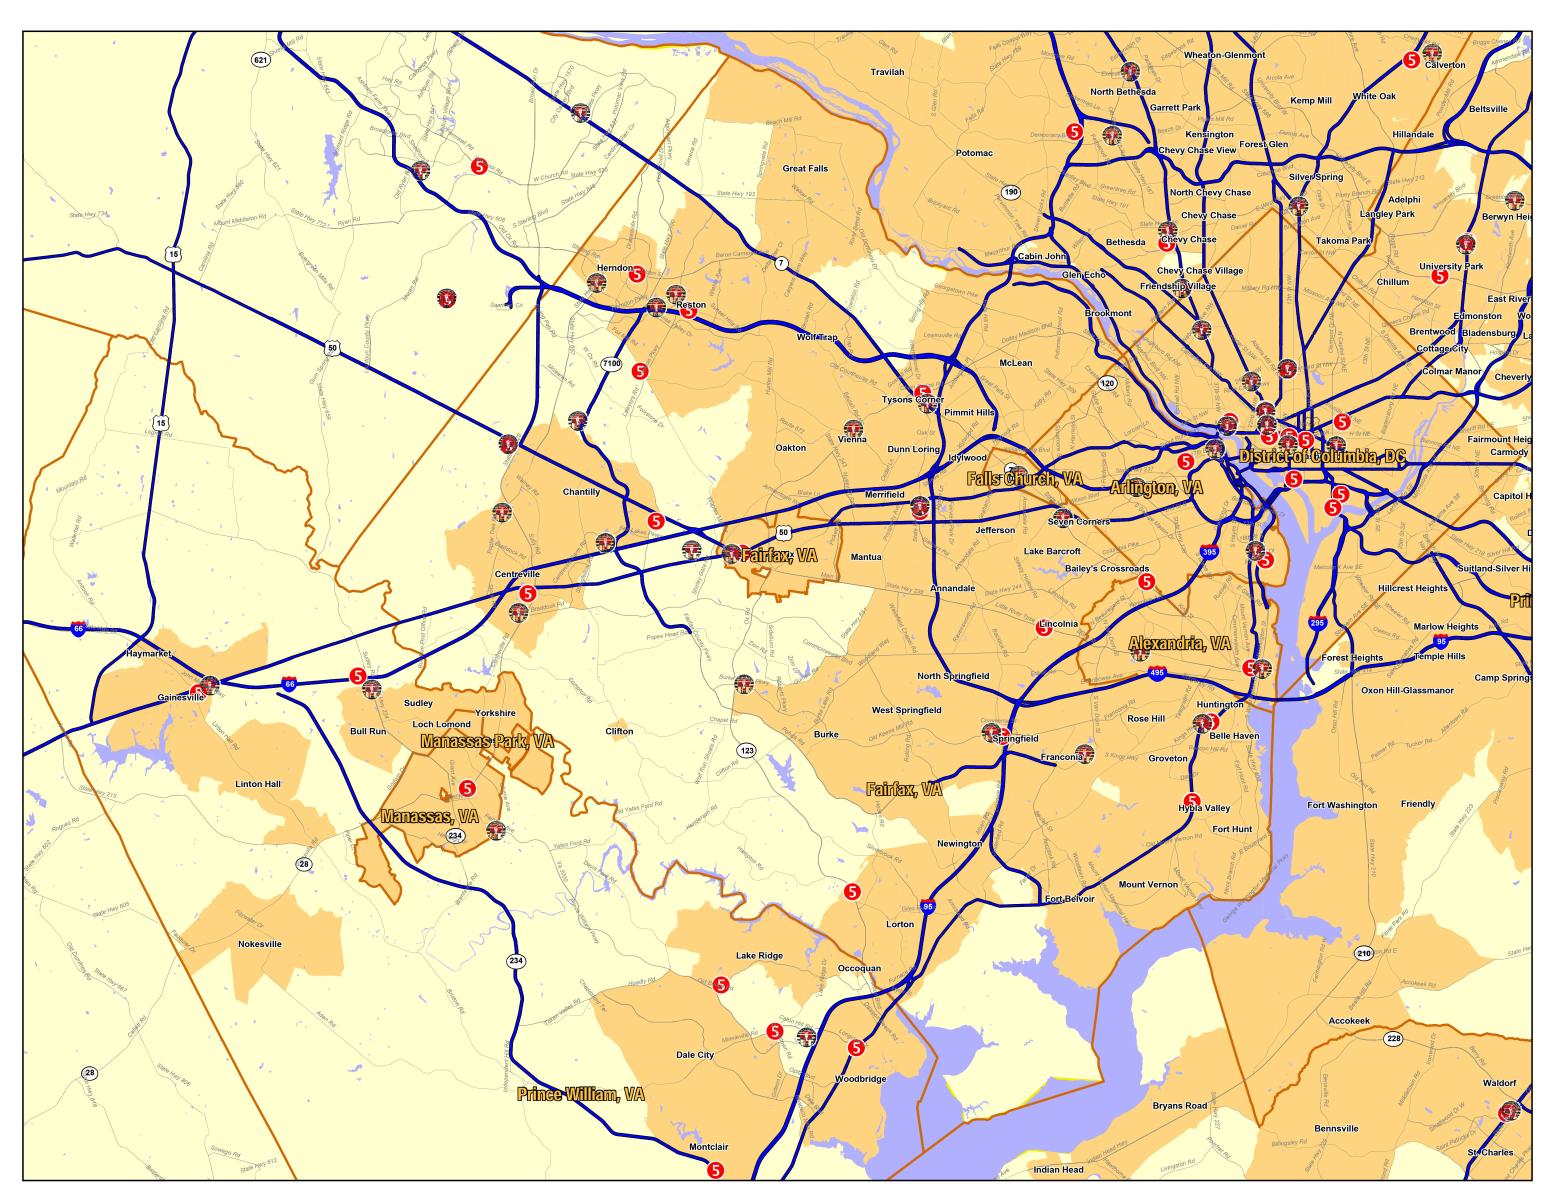 Category map showing restaurant locations throughout the Fairfax, VA market including town/city boundaries and detailed street data.
Want a quick quote? Fill out the information below with your map needs and we will respond as soon as possible with a quote and timeline.