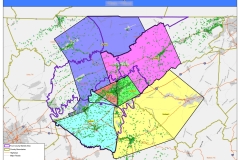
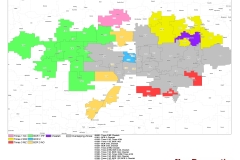
New Perspective can create precise territories utilizing market intelligence. Territory Mapping offers unique challenges, often balancing external data (such as prospect lists, market attributes, population densities) with geographic demands. Territory maps must be accurate and complete to ensure no sections of the market are missed or duplicated between territories. Our sophisticated tools and experience mean your territory maps are as accurate and comprehensive as possible.
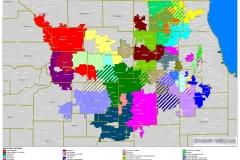 As part of a larger project, sales territories from all departments were aggregated onto a large market map. It was critical to clearly identify overlapping territories as different departments were shown on the same map. New Perspective incorporated a number of design elements to make this complicated data easier to read. This map was printed as a poster for the board room.
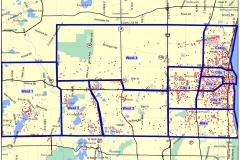 Customer had purchased a local business prospect list and wanted to use it as the basis for sales territory creation. Customer worked with New Perspective to create initial territories, then local business data was aggregated, in total and by category, to measure viability of each zone. Any zones out of balance were adjusted and re-measured until an acceptable level of parity between zones was achieved.
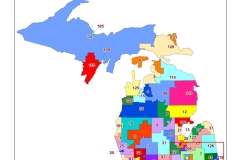 Client required non-overlapping territories for each field agent. New Perspective started with a base set of territories that were first cleaned and aligned, then with client assistance adjustments to territories were made, ensuring all affected territories were re-drawn with no gaps or overlaps. Customer relied on New Perspective for periodic updates for many years.
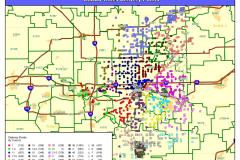 Publication wanted to create distribution zones that were compatible with delivery trucks. First step was to plot all delivery drop points and color-code them by truck ID. Next, hulls were created around each set of delivery points. Territories were finalized by eliminating all gaps and overlaps between them.
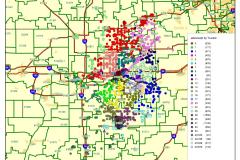 Publication wanted to create distribution zones that were compatible with delivery trucks. First step was to plot all delivery drop points and color-code them by truck ID. Next, hulls were created around each set of delivery points. Territories were finalized by eliminating all gaps and overlaps between them.
Want a quick quote? Fill out the information below with your map needs and we will respond as soon as possible with a quote and timeline.
